August 12, 2025 by 100XBuilds Team
Sales Forecasting: Predictable Revenue for Custom Builders
"We went from guessing our quarterly revenue to predicting it within 3% accuracy. Our cash flow planning transformed overnight." - Regional VP, $12M custom builder
The $2.3M Revenue Swing That Changed Everything
Last quarter, a luxury builder in Austin faced a brutal reality: their revenue forecast was off by $2.3 million. Projects they counted on fell through. Clients they thought were "sure things" vanished. Their cash flow planning crumbled, forcing emergency credit line draws and delayed vendor payments.
The problem wasn't their sales team's effort—it was their forecasting methodology. Custom home builders operate in a unique sales environment where deals take 6-18 months to close, average project values exceed $800K, and pipeline visibility determines survival.

Traditional sales forecasting fails custom builders because it treats a $1.2M custom home like a $50K kitchen remodel. The stakes, timelines, and decision-making processes are fundamentally different.
The Custom Builder Forecasting Framework
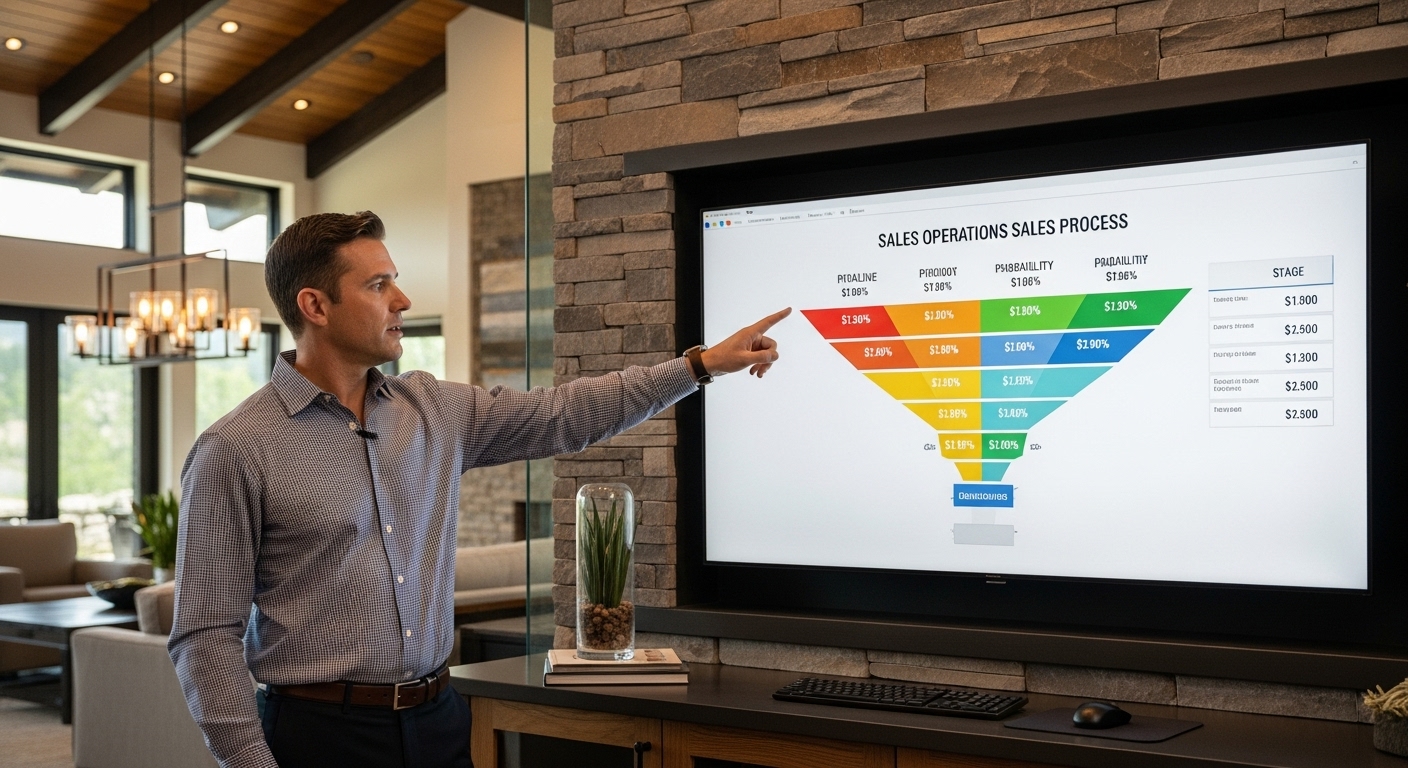
Stage-Based Probability Weighting
Your forecasting accuracy depends on understanding that not all pipeline stages carry equal weight. Here's the proven probability model for custom builders:
Initial Consultation (5% probability)
- Prospect has attended design meeting
- Budget range confirmed ($500K+ minimum)
- Timeline discussed (6+ months out)
Lot Secured/Design Phase (25% probability)
- Client owns lot or has purchase contract
- Preliminary design concepts approved
- Budget refined to specific range
Permit Application Submitted (45% probability)
- Final plans submitted to municipality
- Construction loan pre-approval obtained
- Material selections 80% complete
Permits Approved (75% probability)
- All municipal approvals received
- Construction loan funded
- Signed construction contract
Construction Started (95% probability)
- Foundation poured
- First draw completed
- Project officially in production
The 90-Day Rolling Forecast Model
Most builders forecast quarterly, but custom home sales cycles demand more granular visibility. Implement a 90-day rolling forecast that updates weekly:
Week 1-4: High Confidence (75%+ probability deals)
- Projects with permits approved or construction started
- Contracts signed with financing confirmed
- Revenue timing based on draw schedules
Week 5-8: Medium Confidence (45-74% probability deals)
- Permit applications submitted
- Design phase 90% complete
- Financing pre-approved
Week 9-12: Pipeline Development (25-44% probability deals)
- Lot secured, design in progress
- Budget confirmed, timeline established
- Decision-maker engagement verified
Leading Indicator Tracking
Revenue forecasting requires monitoring activities that predict future pipeline health:
Design Consultation Velocity
- Target: 8-12 qualified consultations monthly
- Conversion rate: 35-45% to design phase
- Average time to conversion: 21 days
Lot Acquisition Rate
- Clients securing lots within 60 days of design approval
- Indicates serious buying intent
- Strong predictor of permit application timing
Permit Application Success Rate
- Municipal approval percentage and timeline
- Identifies potential revenue delays
- Allows proactive client communication

Advanced Forecasting Techniques
Seasonal Adjustment Modeling
Custom home sales follow predictable seasonal patterns that must factor into forecasting:
Q1 (January-March): Planning Phase
- 15% below annual average
- Design consultations peak
- Lot shopping activity increases
Q2 (April-June): Decision Season
- 25% above annual average
- Permit applications surge
- Construction starts accelerate
Q3 (July-September): Construction Peak
- 35% above annual average
- Maximum project velocity
- Revenue recognition highest
Q4 (October-December): Planning Reset
- 10% below annual average
- Holiday decision delays
- Next year pipeline building
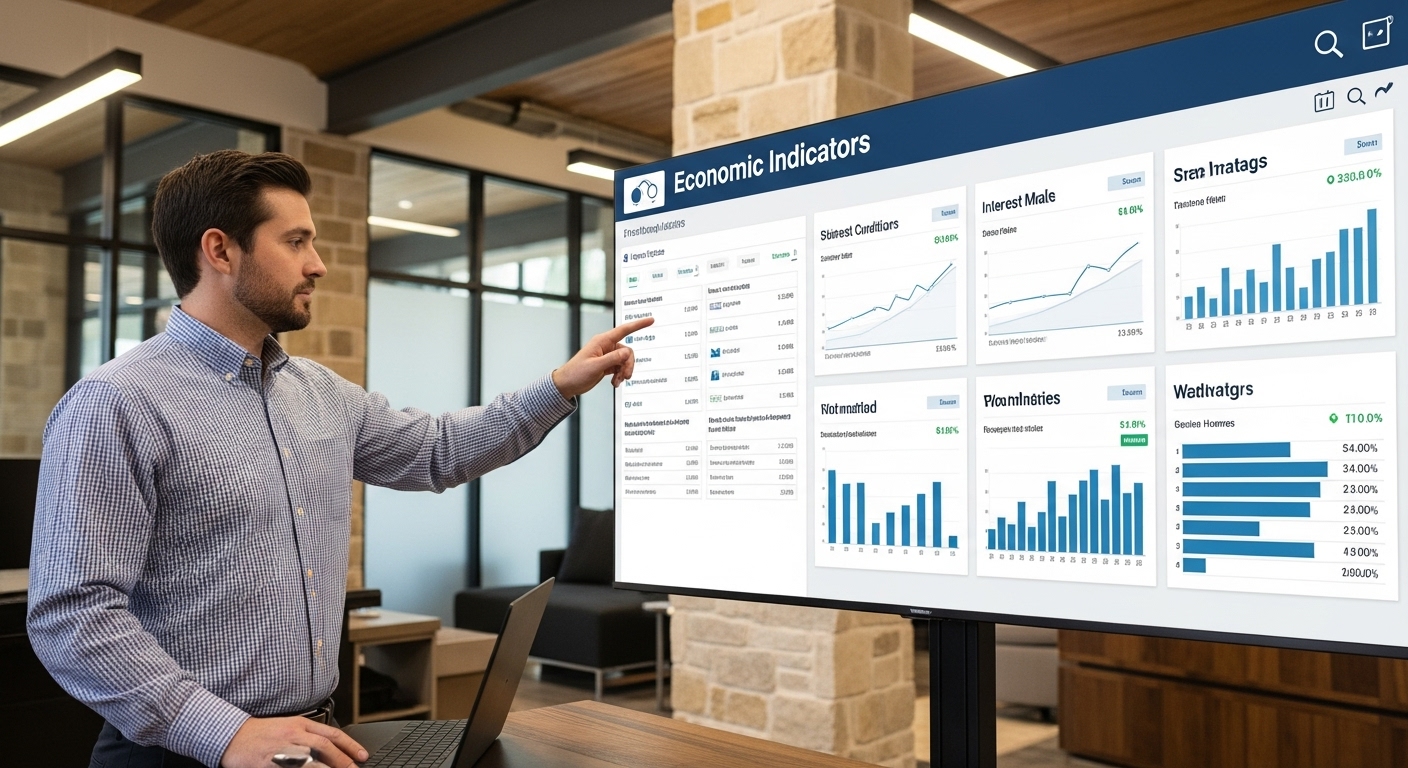
Economic Sensitivity Analysis
Luxury custom homes are economically sensitive. Build economic indicators into your forecasting model:
Interest Rate Impact
- Every 1% rate increase reduces pipeline by 15-20%
- Affects financing approval rates
- Delays decision timing by 30-45 days
Local Market Conditions
- New home inventory levels
- Lot availability and pricing
- Competitor activity and pricing
Client Wealth Indicators
- Stock market performance (affects discretionary spending)
- Local employment rates in high-income sectors
- Real estate appreciation trends
Technology Stack for Accurate Forecasting
CRM Configuration Requirements
Your CRM must capture custom builder-specific data points:
Pipeline Stage Automation
- Automatic stage progression based on activities
- Required fields for each stage advancement
- Probability weighting built into calculations
Activity Tracking Integration
- Design meeting outcomes
- Permit application status
- Financing milestone updates
Revenue Recognition Rules
- Draw schedule integration
- Change order impact calculation
- Completion percentage tracking
Reporting Dashboard Essentials
Build executive dashboards that provide instant pipeline visibility:
Pipeline Health Metrics
- Total pipeline value by probability tier
- Average deal size trending
- Stage conversion rates and timing
Revenue Predictability Indicators
- 90-day rolling forecast accuracy
- Pipeline velocity measurements
- Leading indicator performance
Risk Assessment Alerts
- Deals stalled beyond normal stage duration
- Financing approval delays
- Permit application rejections

Implementation Roadmap
Phase 1: Data Foundation (Weeks 1-2)
Historical Analysis
- Export 24 months of sales data
- Identify actual stage conversion rates
- Calculate average time in each stage
Probability Calibration
- Compare historical close rates by stage
- Adjust probability weightings based on actual performance
- Account for seasonal variations
Phase 2: Process Implementation (Weeks 3-4)
Sales Team Training
- Stage definition clarity
- Required activities for advancement
- Data entry consistency requirements
CRM Configuration
- Custom fields for builder-specific data
- Automated workflows and notifications
- Reporting dashboard creation
Phase 3: Forecasting Activation (Weeks 5-6)
Weekly Forecast Reviews
- Pipeline analysis with sales team
- Probability assessment updates
- Revenue timing adjustments
Executive Reporting
- Monthly board-ready forecasts
- Quarterly accuracy assessments
- Annual planning integration
Measuring Forecasting Success
Accuracy Metrics
Forecast Accuracy Rate
- Target: 90%+ accuracy within 10% variance
- Measure monthly and quarterly performance
- Track improvement trends over time
Pipeline Velocity
- Average days in each stage
- Stage conversion percentages
- Overall sales cycle length
Revenue Timing Precision
- Actual vs. forecasted revenue recognition
- Draw schedule adherence rates
- Project completion variance

ROI Calculation
Accurate forecasting delivers measurable business value:
Cash Flow Optimization
- Reduced emergency credit line usage
- Improved vendor payment timing
- Strategic investment planning capability
Resource Planning Efficiency
- Optimal crew scheduling and utilization
- Material procurement timing
- Subcontractor capacity planning
Growth Planning Confidence
- Accurate hiring decisions
- Market expansion timing
- Investment opportunity evaluation
The Competitive Advantage
Builders with predictable revenue forecasting gain significant competitive advantages:
Financial Institution Relationships
- Stronger credit applications with accurate projections
- Better loan terms based on demonstrated predictability
- Increased credit line availability
Operational Excellence
- Proactive resource allocation
- Reduced project delays and cost overruns
- Improved client satisfaction through better planning
Strategic Decision Making
- Data-driven market expansion decisions
- Accurate ROI projections for new initiatives
- Confident pricing strategy adjustments
Your Next Steps
Implementing predictable revenue forecasting requires commitment to process and technology. Start with historical data analysis to establish your baseline conversion rates and stage durations.
Configure your CRM to capture the specific data points that drive custom home sales decisions. Train your sales team on consistent pipeline management and stage advancement criteria.
Most importantly, commit to weekly forecast reviews and monthly accuracy assessments. Forecasting accuracy improves through consistent measurement and refinement.
Ready to transform your revenue predictability from guesswork to science? Our sales forecasting implementation program has helped 47 custom builders achieve 90%+ forecast accuracy within 90 days.
Schedule your forecasting assessment call today and discover how predictable revenue can transform your business planning, cash flow management, and growth trajectory.
