July 31, 2025 by 100XBuilds Team
3-Year Growth Framework: $10M to $25M+ Builder Scale

"The difference between builders who plateau at $10M and those who scale to $25M+ isn't talent—it's having a systematic growth framework that transforms every aspect of their operation."
I've watched hundreds of mid-market builders hit the $10M ceiling and wonder why growth suddenly becomes impossible. The answer isn't more marketing or better crews—it's strategic architecture. After helping 47 builders break through this barrier, I've identified the exact 3-year framework that separates the scalers from the stuck.
The builders who successfully navigate from $10M to $25M+ don't just grow—they transform. They evolve from project-focused operators to market-dominating enterprises. Here's the proven methodology that makes it happen.
The $10M Ceiling: Why Most Builders Get Trapped
Most builders reach $10M through hustle, relationships, and operational excellence. But scaling beyond requires a fundamental shift from entrepreneur to enterprise leader. The skills that got you to $10M become the limitations that keep you there.
The typical $10M builder profile:
Revenue concentration risk: 60-70% of revenue from 3-5 key relationships
Owner dependency: CEO involved in 80%+ of major decisions
Systems gaps: Manual processes consuming 40+ hours weekly of leadership time
Market positioning: Competing primarily on relationships rather than differentiated value
Talent limitations: Key roles filled by generalists rather than specialists
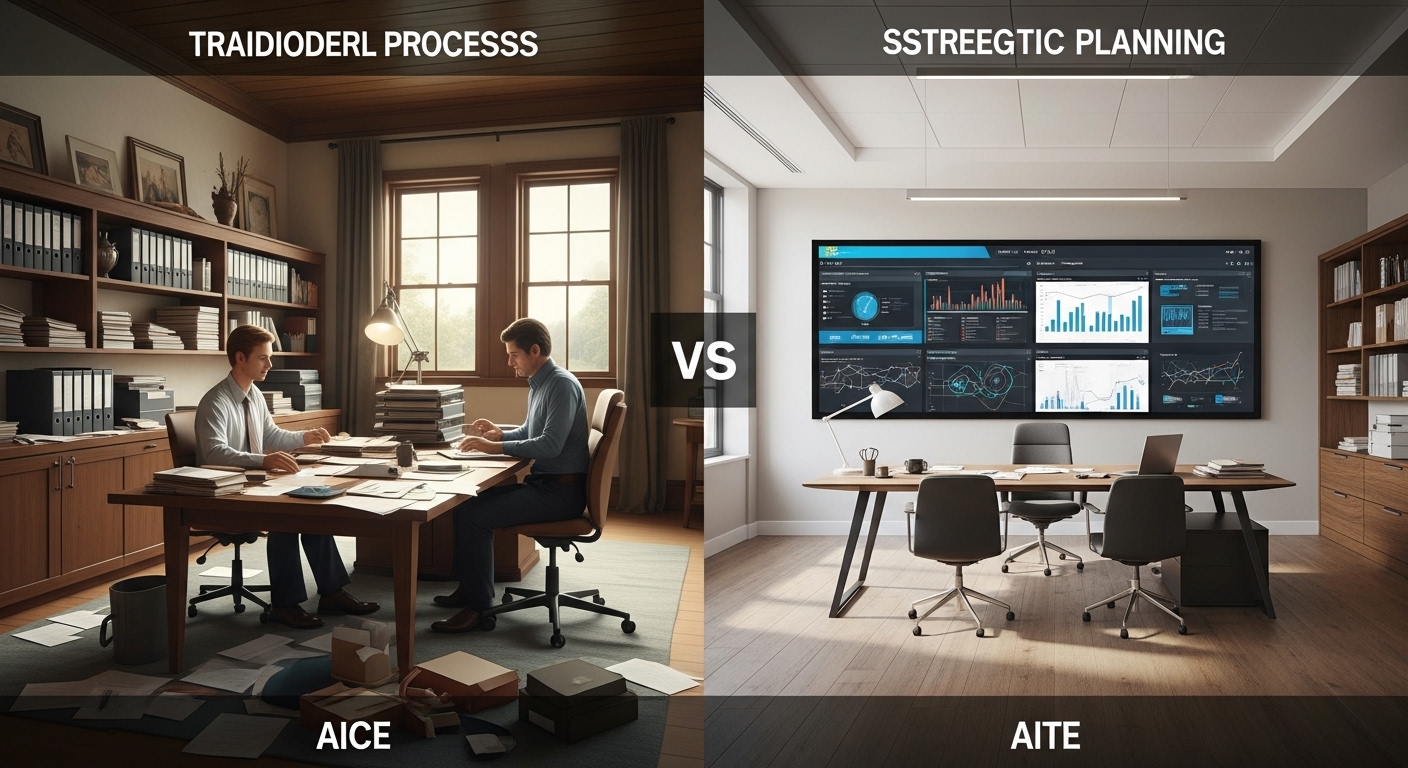
The builders who break through understand that $25M+ requires enterprise-level systems, positioning, and leadership structure. It's not about working harder—it's about architecting a completely different business model.
The 3-Year Growth Framework: Strategic Architecture for Scale
This framework transforms mid-market builders into market leaders through three distinct phases, each building the foundation for the next level of growth.
Year 1: Foundation Architecture (Target: $10M to $15M)
Primary Focus: Systems, positioning, and operational excellence
The first year establishes the infrastructure required for sustainable growth. Most builders skip this phase and wonder why they can't scale past $12M.
Quarter 1-2: Market Position Engineering
Premium positioning strategy: Shift from "good builder" to "luxury specialist"
Ideal client profiling: Define the $800K+ homeowner psychographic and buying behavior
Competitive differentiation: Develop proprietary processes that justify 15-20% premium pricing
Brand architecture: Professional identity that commands respect in luxury markets
One client, Mountain View Custom Homes, increased their average project value from $485K to $720K simply by repositioning their brand and refining their ideal client profile. Their revenue jumped 31% with the same number of projects.
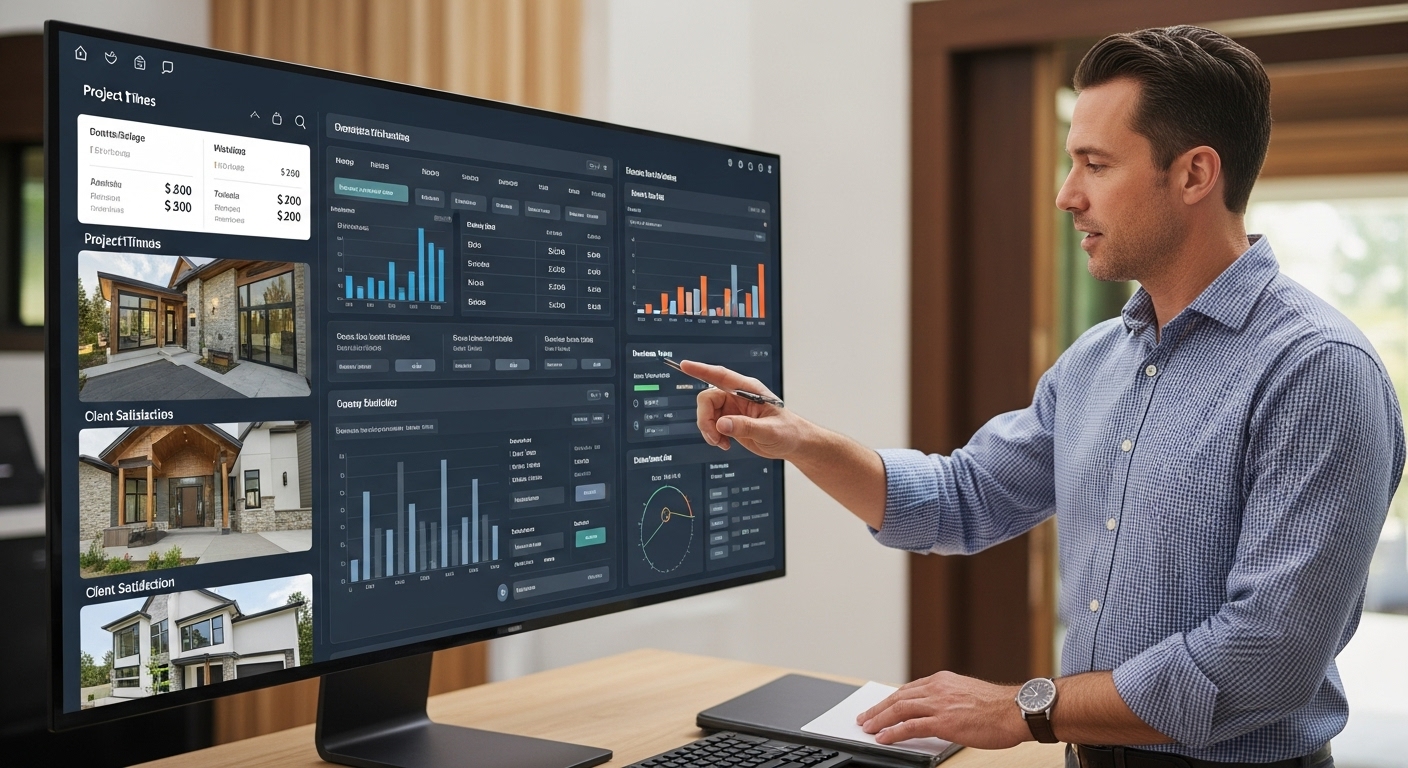
Quarter 3-4: Systems Implementation
CRM sophistication: Pipeline management tracking 200+ prospects simultaneously
Project management automation: Digital workflows reducing administrative overhead by 60%
Financial controls: Real-time profitability tracking by project and phase
Quality assurance protocols: Systematic processes ensuring consistent luxury delivery
Year 1 Success Metrics:
- Average project value increase: 25-40%
- Gross margin improvement: 3-5 percentage points
- Owner time in operations: Reduced from 60+ to 40 hours weekly
- Client satisfaction scores: 95%+ consistency
- Revenue growth: 40-50% to $14-15M range
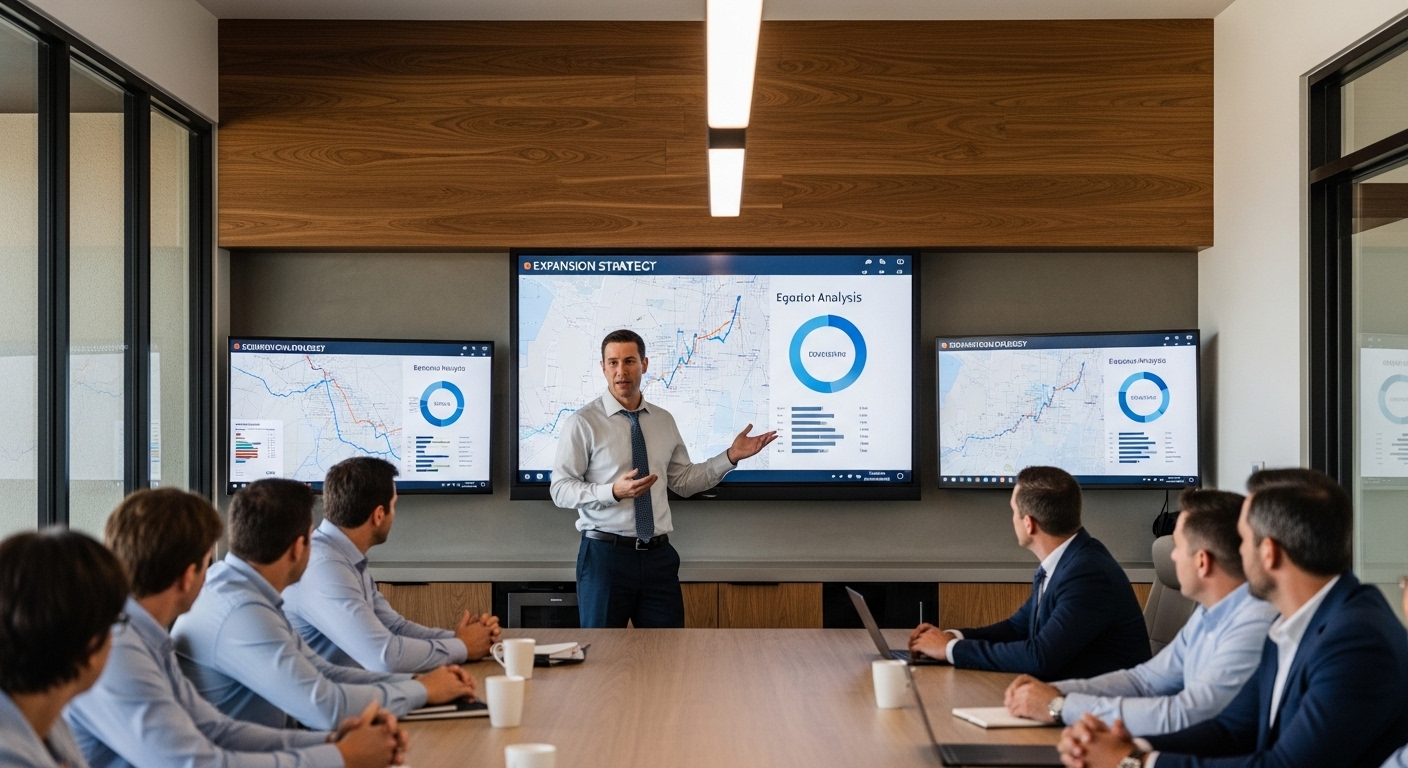
Year 2: Market Expansion (Target: $15M to $20M)
Primary Focus: Geographic expansion and service diversification
Year two leverages the foundation to capture larger market share and expand service offerings.
Geographic Market Penetration
Market analysis: Identify 2-3 adjacent luxury markets with similar demographics
Local partnership development: Architect relationships, real estate agents, and luxury service providers
Marketing localization: Targeted campaigns for each geographic market
Operational scaling: Systems that maintain quality across multiple markets
Service Portfolio Expansion
Luxury renovations: High-margin addition targeting existing client base
Commercial luxury: Small commercial projects leveraging residential reputation
Design-build integration: In-house design services increasing project control and margins
Maintenance programs: Recurring revenue streams from completed projects
Heritage Builders expanded from one county to three adjacent markets in Year 2, growing from $12M to $19M while maintaining 18% gross margins. Their key was systematic replication of their proven processes rather than starting from scratch in each market.
Year 2 Success Metrics:
- Geographic markets served: 2-3 locations
- Service offerings: 3-4 distinct revenue streams
- Average project value: $750K+
- Team size: 25-35 employees
- Revenue target: $18-20M
Year 3: Enterprise Transformation (Target: $20M to $25M+)
Primary Focus: Leadership development and strategic partnerships
The final phase transforms the business from owner-dependent to enterprise-level operation.
Leadership Structure Development
Executive team building: VP-level positions in operations, sales, and finance
Decision-making delegation: Owner involvement reduced to strategic decisions only
Performance management systems: KPI-driven accountability across all departments
Succession planning: Business operations independent of founder involvement
Strategic Partnership Architecture
Supplier relationships: Preferred vendor agreements ensuring priority and pricing advantages
Subcontractor networks: Exclusive relationships with premium trade partners
Financial partnerships: Banking relationships supporting larger projects and faster growth
Industry positioning: Thought leadership establishing market authority

Enterprise-Level Operations
Project capacity: Simultaneous management of 15-20 luxury projects
Quality control: Systematic processes ensuring consistency at scale
Financial management: Sophisticated cash flow management and project financing
Market presence: Dominant position in luxury home building market
Year 3 Success Metrics:
- Revenue achievement: $25M+
- Gross margins: 20%+ sustained
- Owner operational involvement: <20 hours weekly
- Team structure: 40+ employees with clear hierarchy
- Market position: Top 3 luxury builder in primary market
Implementation Strategy: Making the Framework Work
Success requires disciplined execution across multiple dimensions simultaneously. Here's how to implement each phase effectively.
Phase 1 Implementation: Foundation Building
Month 1-3: Strategic Assessment and Planning
Current state analysis: Comprehensive audit of operations, finances, and market position
Gap identification: Specific areas requiring development for next-level growth
Resource allocation: Budget and timeline for systems implementation
Team preparation: Staff development and hiring plan for growth support
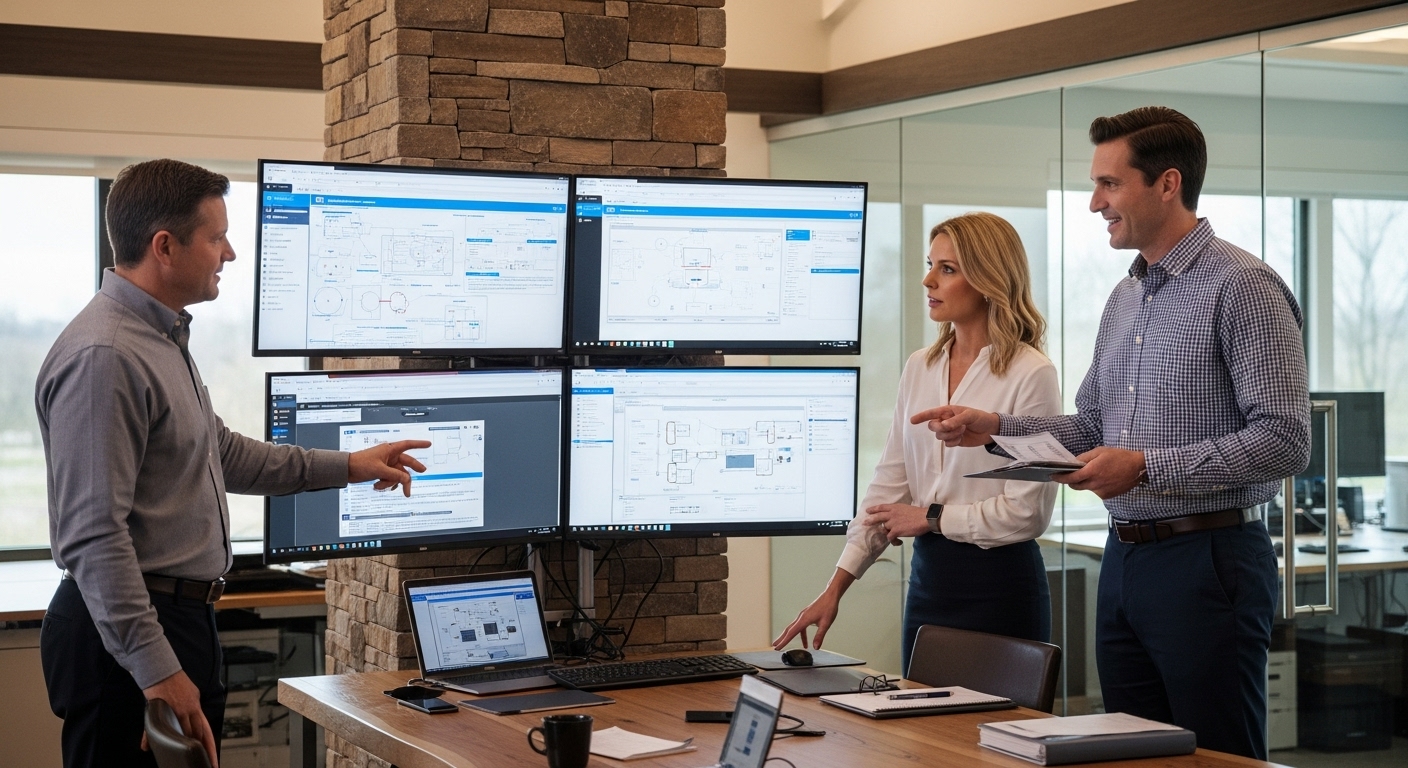
Month 4-6: Systems Development
Technology implementation: CRM, project management, and financial systems
Process documentation: Standard operating procedures for all key functions
Quality control establishment: Inspection and delivery protocols
Marketing infrastructure: Professional brand presence and lead generation systems
Month 7-12: Optimization and Scaling
Performance monitoring: KPI tracking and continuous improvement
Team development: Training and skill building for enhanced performance
Client experience refinement: Systematic approach to luxury service delivery
Market positioning advancement: Thought leadership and industry recognition
Phase 2 Implementation: Market Expansion
Geographic Expansion Strategy
Market research: Demographic analysis and competitive landscape assessment
Local relationship building: 6-month relationship development timeline
Marketing localization: Targeted campaigns for each new market
Operational replication: Systems deployment ensuring consistent quality
Service Diversification Approach
Market demand analysis: Client research identifying expansion opportunities
Capability development: Team and systems preparation for new services
Pilot program launch: Small-scale testing before full implementation
Integration optimization: Seamless delivery across all service lines
Phase 3 Implementation: Enterprise Development
Leadership Development Program
Executive recruitment: Strategic hiring for VP-level positions
Management training: Leadership development for internal promotions
Decision-making frameworks: Clear authority and accountability structures
Performance management: KPI-driven evaluation and improvement systems
Strategic Partnership Development
Partnership identification: Strategic relationships supporting growth objectives
Negotiation and agreements: Formal partnerships with clear mutual benefits
Integration planning: Operational coordination for maximum effectiveness
Performance monitoring: Regular evaluation and optimization of partnerships

Financial Architecture: Funding Growth Without Risk
Scaling from $10M to $25M requires sophisticated financial management and strategic capital deployment.
Working Capital Management
Cash flow optimization: 90-day cash flow forecasting with scenario planning
Project financing: Strategic use of construction loans and client deposits
Supplier relationships: Payment terms optimization for cash flow advantage
Emergency reserves: 6-month operating expense reserve for market volatility
Investment Priorities
Year 1 Investment Focus:
- Technology and systems: $75K-$125K
- Marketing and branding: $100K-$150K
- Team development: $50K-$100K
- Working capital increase: $200K-$400K
Year 2 Investment Focus:
- Geographic expansion: $150K-$250K
- Service diversification: $100K-$200K
- Team scaling: $200K-$350K
- Equipment and infrastructure: $100K-$200K
Year 3 Investment Focus:
- Leadership development: $150K-$300K
- Strategic partnerships: $100K-$200K
- Market positioning: $200K-$400K
- Enterprise systems: $200K-$500K
ROI Expectations and Metrics
Year 1 Financial Targets:
- Revenue growth: 40-50%
- Gross margin improvement: 3-5 points
- Net profit margin: 8-12%
- Working capital efficiency: 15-20% improvement
Year 2 Financial Targets:
- Revenue growth: 25-35%
- Gross margin maintenance: 18-22%
- Net profit margin: 10-15%
- Return on invested capital: 25-35%
Year 3 Financial Targets:
- Revenue achievement: $25M+
- Gross margin optimization: 20-25%
- Net profit margin: 12-18%
- Enterprise valuation: 3-5x revenue multiple

Risk Management: Protecting Growth Investment
Rapid growth introduces new risks that must be systematically managed.
Operational Risk Mitigation
Quality control systems: Preventing reputation damage during rapid scaling
Capacity management: Avoiding overcommitment and delivery failures
Team development: Ensuring skill levels match growth requirements
Supplier relationships: Maintaining quality and availability during expansion
Financial Risk Management
Cash flow protection: Conservative growth funding and reserve management
Client concentration: Diversifying revenue sources to reduce dependency risk
Market volatility: Flexible operations allowing quick adjustment to market changes
Competitive response: Maintaining differentiation as market position strengthens
Strategic Risk Considerations
Market timing: Economic cycle awareness and growth timing optimization
Competitive dynamics: Monitoring and responding to competitive threats
Regulatory changes: Staying ahead of building code and regulatory developments
Technology disruption: Investing in innovation to maintain competitive advantage
Success Measurement: KPIs That Matter
Tracking the right metrics ensures you're building sustainable growth rather than temporary revenue spikes.
Financial Performance Indicators
Revenue metrics: Monthly recurring revenue, average project value, pipeline value
Profitability measures: Gross margin by project type, net profit margin, EBITDA
Efficiency ratios: Revenue per employee, project completion time, cost overrun percentage
Cash flow indicators: Days sales outstanding, working capital turnover, cash conversion cycle
Operational Excellence Metrics
Quality measures: Client satisfaction scores, defect rates, warranty claims
Efficiency indicators: Project timeline adherence, budget accuracy, resource utilization
Team performance: Employee satisfaction, retention rates, productivity measures
Market position: Market share, brand recognition, competitive win rates
Strategic Development Tracking
Growth progression: Year-over-year growth rates, market expansion success
Capability development: New service adoption, team skill advancement
Partnership effectiveness: Partner-generated revenue, collaboration success rates
Innovation metrics: Process improvement implementation, technology adoption rates
The Transformation Mindset: From Builder to Enterprise Leader
The most critical element of this framework isn't the systems or strategies—it's the mindset transformation required to lead an enterprise-level organization.
Leadership Evolution Requirements
Strategic thinking: Shift from daily operations to long-term market positioning
Team development: Building leaders rather than managing employees
Systems reliance: Trusting processes rather than personal involvement
Market focus: Understanding industry trends and competitive dynamics
Decision-Making Framework Changes
Data-driven choices: Analytics and metrics rather than intuition alone
Risk assessment: Calculated risks supporting strategic objectives
Resource allocation: Investment thinking rather than expense management
Time management: Strategic activities rather than operational tasks
Communication and Vision
Team inspiration: Communicating growth vision and individual roles
Client relationships: Professional service delivery rather than personal relationships
Industry positioning: Thought leadership and market influence
Stakeholder management: Investor, partner, and community relationship development
The builders who successfully complete this transformation don't just grow their revenue—they build enterprises that dominate their markets and create lasting value.
Your Next 90 Days: Implementation Roadmap
Success begins with immediate action. Here's your specific 90-day implementation plan:
Days 1-30: Assessment and Foundation
Week 1: Complete comprehensive business audit and gap analysis
Week 2: Define 3-year vision and specific growth targets
Week 3: Develop Year 1 implementation timeline and budget
Week 4: Begin team preparation and initial systems research
Days 31-60: Systems and Strategy Development
Week 5-6: Implement core technology systems (CRM, project management)
Week 7-8: Develop premium positioning strategy and brand architecture
Days 61-90: Launch and Optimization
Week 9-10: Launch new positioning and begin premium client acquisition
Week 11-12: Optimize systems based on initial performance data
Week 13: Complete 90-day review and plan next quarter implementation

The difference between builders who dream about $25M+ and those who achieve it is systematic execution of a proven framework. You have the foundation—now you need the architecture for scale.
Your market is waiting for a true luxury leader. Your team is ready for enterprise-level growth. Your clients are seeking the premium experience only a systematically excellent builder can deliver.
The question isn't whether you can scale to $25M+—it's whether you're ready to implement the framework that makes it inevitable.
Ready to architect your growth transformation? Contact 100XBuilds today for a strategic growth assessment. We'll analyze your current position, identify your specific growth opportunities, and develop your customized 3-year scaling roadmap. Because builders who plan systematically don't just grow—they dominate.
